Analytic Function Examples
Oracle Discoverer supports the Analytic Functions that are included in Oracle Server 8.1.6 and above. Discoverer also extends the functionality of standard SQL by allowing you to nest Analytic Functions. You can use these advanced functions to perform sophisticated analysis on your data.
This section contains the following sub-sections:
Analytic Function Categories
Analytic Functions are classified in the following categories:
- Ranking - Address business questions like: `What are the top 10 and bottom 10 salespeople per region?'.
- Banding - Address business questions like `What brands make up 25% of sales?'.
- Windowing - Address business questions like `What is the 13-week moving average of a stock price?' or `What is the cumulative sum of sales per region?'.
- Reporting Aggregates - After a query has been processed, aggregate values like the number of resulting rows, or the sum of a column in a set of rows. Address questions like `What are each product's Sales as a percentage of Sales for its product group?'.
- Lag/Lead - Address business questions like `Which regions growth of sales of 1998 as compared to 1997 was greater than 20%?', and `What is the value of Sales in Financial Year 1996 minus Sales in Financial Year 1996?'.
- Statistics - Perform statistical analysis with Business Intelligence OLAP/spreadsheet applications. For example, covariance and linear regression functions.
Calculations and Drilling Into and out of data
When you use Analytic Functions, note that they have a precise definition which does not change as you drill, pivot, or sort the result set. For example, if you use the RANK function to assign ranks to sales figures partitioned by Quarter, if you drill down the Month level, the rank still only applies to the Quarter level.
About The Analytic Function Template
When creating Analytic Functions in Discoverer, you can either type or paste them directly into the Calculation dialog box, or you can select them from the function list.
If you select them from the function list, you are presented with a generic Analytic Function Template that helps you define the function by telling you what information you may need to provide. Templates should be used as a guide. Because templates are designed to cover most types of usage, you will not always need to use every part of the template.
For example, when you paste a new RANK Analytic Function into a calculation box, Discoverer provides the following template:
Although you can define a complex function using both expressions (expr1 and expr2), you can often define a simple function using only the ORDER BY expression; for example:
RANK()OVER(ORDER BY 'Sales')
This example ranks sales figures (defined in the `Sales' item).
NOTE: By default, results data is sorted in ascending order (ASC), nulls first (NULLS FIRST).
For more information about expressions used by the Analytic Function template, refer to "More about the Analytic Function Template".
Ranking Function Examples
About Ranking
Ranking functions compute the rank of an item with respect to other items in an ordered list.
Assign Ranks to sales figures
This example ranks a set of sales figures.
Table 5-4 Workbook configuration for `Assign Ranks to sales figures'
Assign Ranks to sales figures within Region
This example ranks a set of sales figures within each Region for each Year.
Table 5-5 Workbook configuration for `Assign Ranks to sales figures within Region'
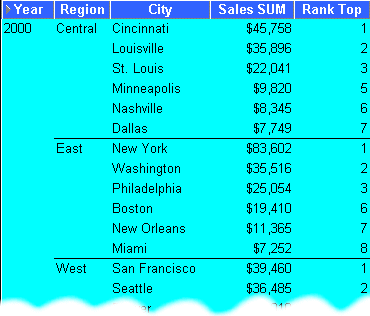
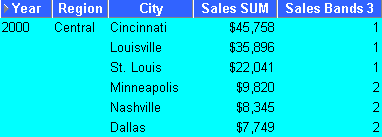
Show the top three selling Cities per Region
This example ranks a set of sales figures and displays the top three selling Cities for each Region.
Table 5-6 Workbook configuration for `Show the top three selling Cities per Region'
Show the top three and bottom three selling Cities per Region
This example ranks a set of sales figures and displays the top three and bottom three performing Cities per Region.
Table 5-7 Workbook configuration for `Show the top and bottom three selling Cities per Region'
Banding Function Examples
About Banding
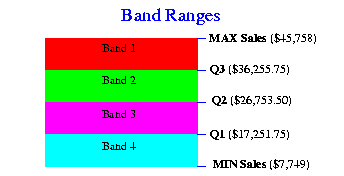
Banding is a type of ranking that divides a list of values in a partition into a specified number of groups called Bands (also known as buckets) and assigns each value to a Band.
Two common types of banding are:
- Banding by value - this divides values into groups according to their value, (also known as equi-width bands).
Here, the function typically takes the largest value minus the lowest value, and divides the result by the number of bands required. This value defines the range of each Band.
Values are then assigned to bands according to which range they fall into. Therefore, the number of values in each Band may differ.
For example, if we have 100 values and divide them into four equi-width bands, each band may contain different numbers of values.
Figure 5-2 Banding By Value
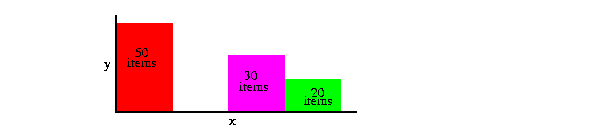
Use the GREATEST function or the CASE function to produce equi-width bands based on value.
- Banding by rank - this divides values into groups according to their rank, (also known as equi-height bands).
Here, the function divides the number of values in the partition by the number of bands, which gives the number of values in each band.
An equal number of values are then placed in each band.
For example, if we have 100 values and divide them into four equi-height bands, each band contains 25 values.
Figure 5-3 Banding By Rank
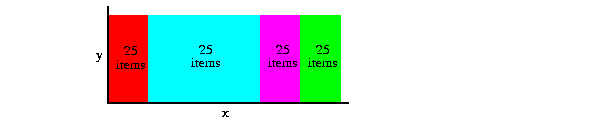
Use the NTILE function to produce equi-height bands based on rank.
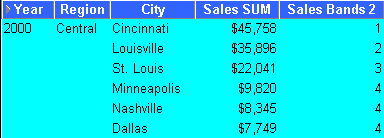
Producing equi-width Bands (1)
This example divides Sales figures into bands according to their value, (also known as equi-width bands).
Table 5-8 Workbook configuration for `Producing equi-width Bands (1)'
Producing equi-width Bands (2)
This example creates the same results as the example in "Producing equi-width Bands (1)", except that it uses a CASE statement rather than the GREATEST function.
Again, the example divides Sales figures into bands according to their value, using a CASE function, (see also
Table 5-9 Workbook configuration for `Producing equi-width Bands (2)'
"Producing equi-width Bands (1)").
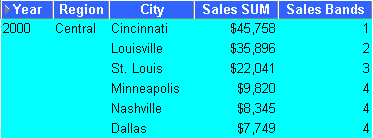
Producing equi-height Bands
This example assigns a set of sales figures into two equi-height Bands.
Table 5-10 Workbook configuration for `Producing equi-height Bands'
Windowing Function Examples
About Windowing
Windowing functions are used to compute aggregates using values from other rows. For example, cumulative, moving, and centered aggregates.
Two common types of windowing are:
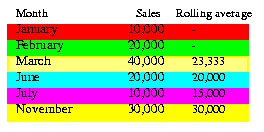 Windowing with logical offsets - here, the offset is based on a value relative to an existing value, e.g. three months preceding a date value.
For example, if we have a list of monthly sales figures, a logical window could compute a moving average of the previous three months, (inclusive of the current month). When calculating the average, the calculation assumes a NULL value for months missing from the list. In the example right, the three-month moving average for November assumes NULL values for the missing months September and October.
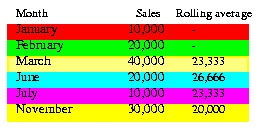 Windowing with physical offsets - here, the offset is based on a value that is a specified number of rows from an existing value, e.g. three rows from the current item.
For example, if we have a list of monthly sales figures, a physical window could compute a moving average of the previous three rows ignoring missing months. When calculating the average, the calculation ignores months missing from the list. In the example above, the three-month moving average for November uses June, July, and November in the calculation.
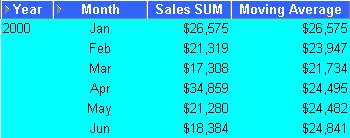
Calculate a three month moving sales average
This example uses a logical window to calculate a moving three month Sales average.
Table 5-11 Workbook configuration for `Calculate a three month moving Sales average'
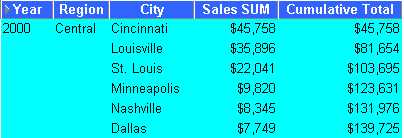
Show the cumulative values of sales
This example uses a physical window to calculate the cumulative value of sales.
Table 5-12 Workbook configuration for `Show the cumulative value of sales'
Reporting Function Examples
About Reporting Functions
Reporting functions are used to compute aggregates.
Calculate annual sales by Year
This example calculates annual sales by Year.
Table 5-13 Workbook configuration for `Calculate annual sales by Year'
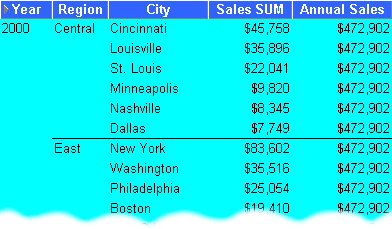
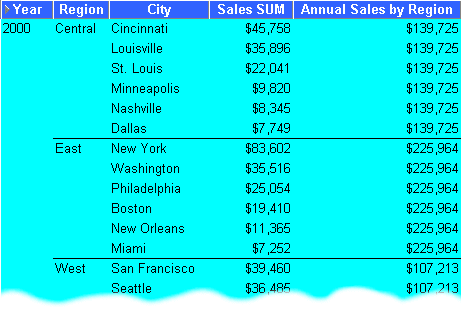
Calculate annual sales by region
This example calculates the total annual sales by Year and Region.
Table 5-14 Workbook configuration for `Calculate annual sales by region'
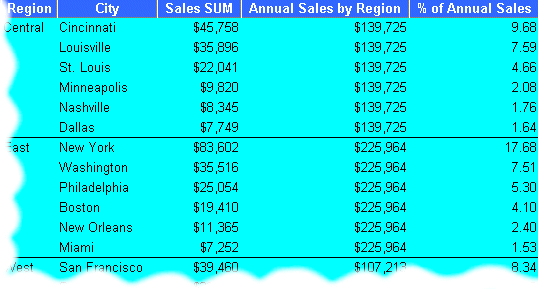
Calculate percentage of annual sales by Region
This example calculates the percentage of annual sales per Region for each City in each Year.
Table 5-15 Workbook configuration for `Calculate percentage of annual sales'
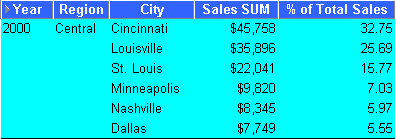
Calculate sales as a percentage of total Sales
This example calculates sales as a percentage of total Sales.
Table 5-16 Workbook configuration for `Calculate sales as a percentage of total profit'
Lag/Lead Function Examples
About Lag/Lead Functions
LAG and LEAD functions are typically used to compare values in different time periods. For example, compare sales figures in 2000 with sales figures in 2001.
- LAG - provides access to more than one row of a table at the same time without a self-join.
- LEAD - provides access to a row at a given offset after the current position.
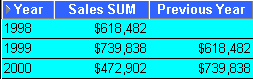
Compare sales figures across time
This example compares sales figures across time.
Table 5-17 Workbook configuration for `Compare sales figures across time'
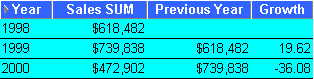
Calculate sales growth across time
Using the comparative sales figures from example "Compare sales figures across time", this example calculates the sales growth across time.
Table 5-18 Workbook configuration for `Calculate sales growth across time'
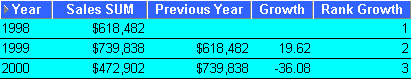
Rank sales growth
Using the comparative sales figures from examples "Compare sales figures across time" and "Calculate sales growth across time", this example ranks sales growth by year.
Table 5-19 Workbook configuration for `Rank sales growth'
Statistical Function Examples
About Statistics Functions
Statistics functions are used to compute covariance, correlation, and linear regression statistics. Each function operates on an unordered set. They also can be used as windowing and reporting functions.
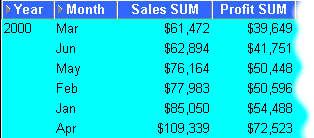
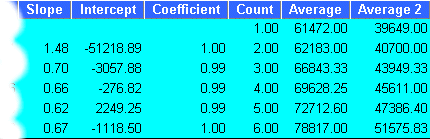
Calculate linear regression
This example computes an ordinary least-squares regression line that expresses the Profit SUM per Month as a linear function of its Sales SUM. The following functions are used:
- SLOPE - slope of determination of the regression line
- INTERCEPT - intercept of determination of the regression line
- REGR_R2 - coefficient of determination of the regression line
- REGR_COUNT - number of items
- REGR_AVGX - average salary
- REGR_AVGY - average bonus
Table 5-20 Workbook configuration for `Calculate sales as a percentage of total profit'